Pilot survey | Results | Next steps
Pilot theme survey
The full EcoTypes survey is comprehensive, with 24 statements covering 12 fundamental environmental considerations, or axes. Viewing your survey report for these axes alone is valuable—but the full survey is quite long. Additionally, your EcoType is derived not directly from axis scores, but indirectly via statistically derived theme scores, and these themes—Place, Knowledge, and Action—are at the heart of our environmental differences. We thus asked: might it be possible to create a quicker survey, based directly on these themes?
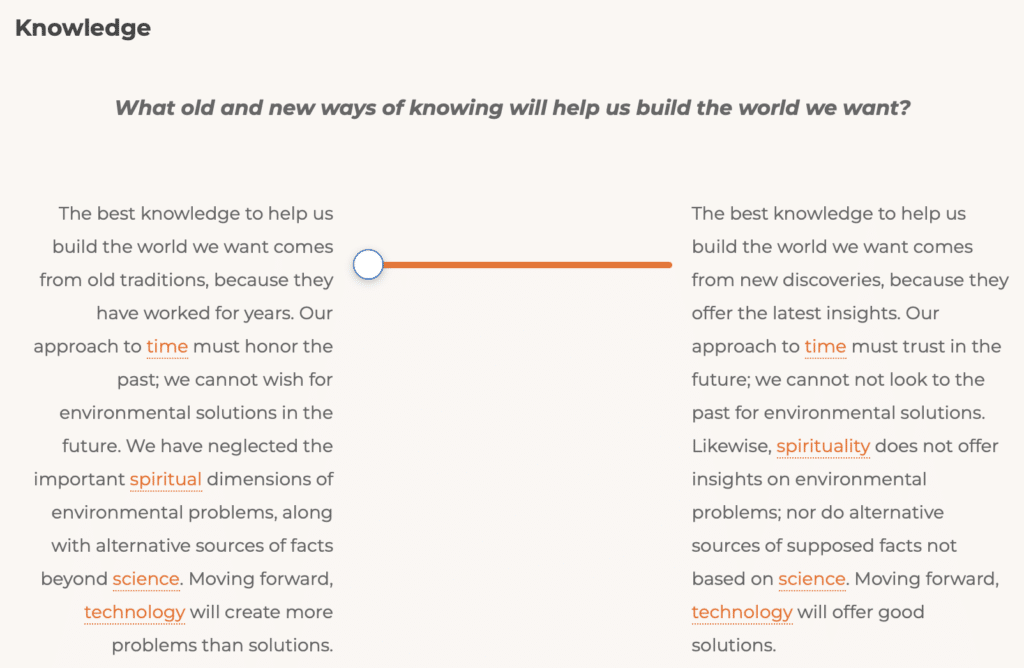
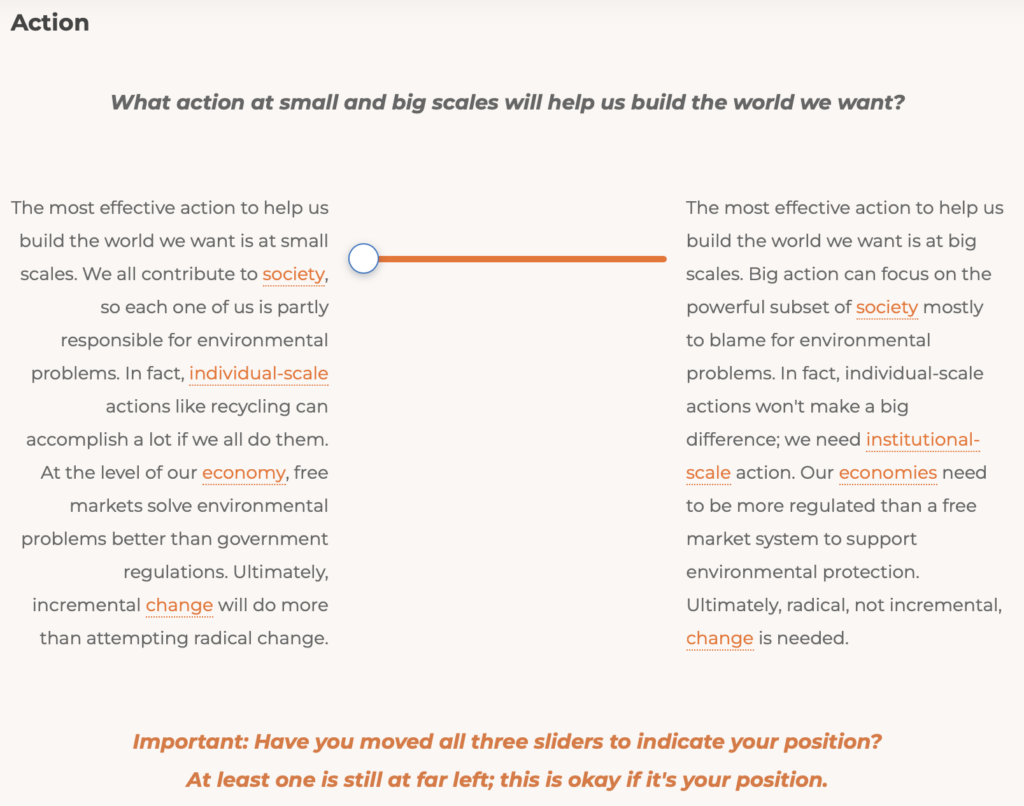
So, in early 2024, we launched a pilot EcoTypes theme survey, a quick one-page version as compared with six pages consisting of 24 axis statements of the full EcoTypes survey. The theme survey, which participants currently encounter following the full survey statements, consists of two contrasting narratives for each of the three statistical EcoTypes themes, for which participants move a slider to position themselves.
As described to participants on the theme survey page:
Each pair of narratives is statistically derived from thousands of EcoTypes responses. They may not be your own words, but they summarize our collective differences over one of three EcoTypes themes: Place, Knowledge, and Action.
What do we mean by “statistically derived” and “collective differences”? The primary method we use is factor analysis, which groups axes by their greatest common differences (variance)—the three themes! Below are factor analysis results of the 2023-24 survey as of February 2024 (n = 2802): this is called a “rotated” component matrix, as the three factors are rotated such that each axis primarily loads onto one theme, so we can more clearly put a name on that theme.
The loading numbers suggest the strength of association between each axis and its factor (theme); as you can tell, all twelve axes are significant contributors to their theme! This is unsurprising, as they were selected in 2022 from eighteen original axes as the ones that loaded the most onto these themes.
The Variance Explained row at bottom summarizes the strength of each theme in accounting for all the differences in these data: overall, Place, Knowledge, and Action account for slightly under one-half of overall variance (a pretty good result with survey data), with Action explaining the most and Place the least. Another way to say this is that, among participants in the 2023-24 survey, their biggest differences were over Action, with Knowledge second and Place third.
| Axis | Place | Knowledge | Action |
|---|---|---|---|
| Ecosystems | 0.664 | ||
| Aesthetics | 0.653 | ||
| Nature | 0.560 | ||
| Ethics | 0.558 | ||
| Technology | 0.691 | ||
| Spirituality | 0.648 | ||
| Science | 0.633 | ||
| Time | 0.590 | ||
| Social Scale | 0.836 | ||
| Change | 0.758 | ||
| Society | 0.705 | ||
| Economies | 0.669 | ||
| Variance Explained | 10.7% | 17.5% | 20.5% |
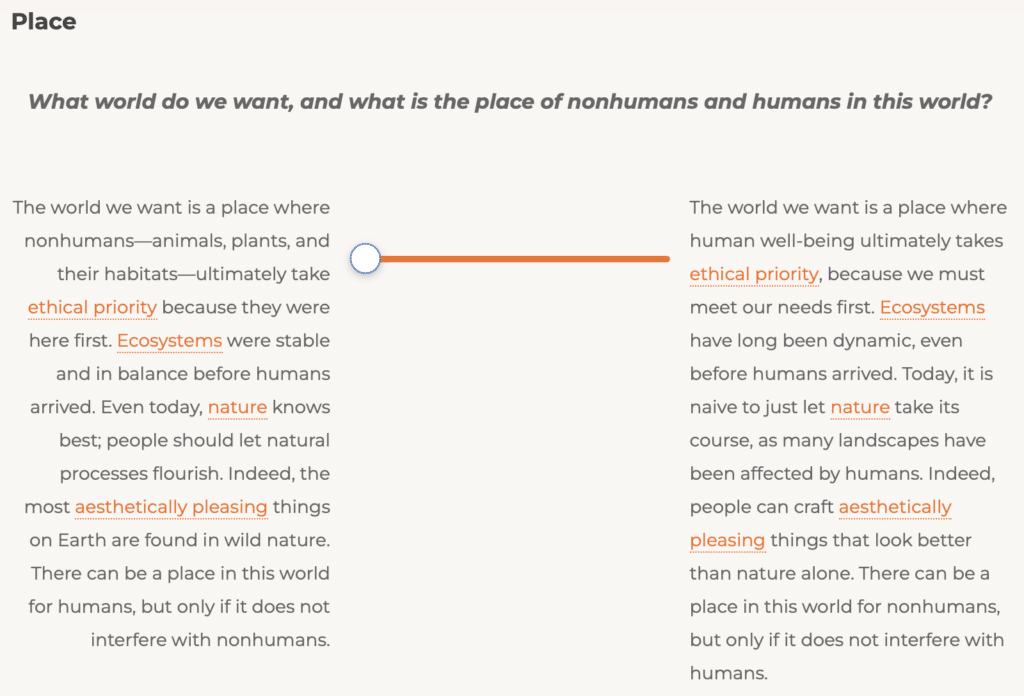
So, our “collective differences” are over Place, Knowledge, and Action, described in the summary narratives simply by combining phrases from related axis statements.
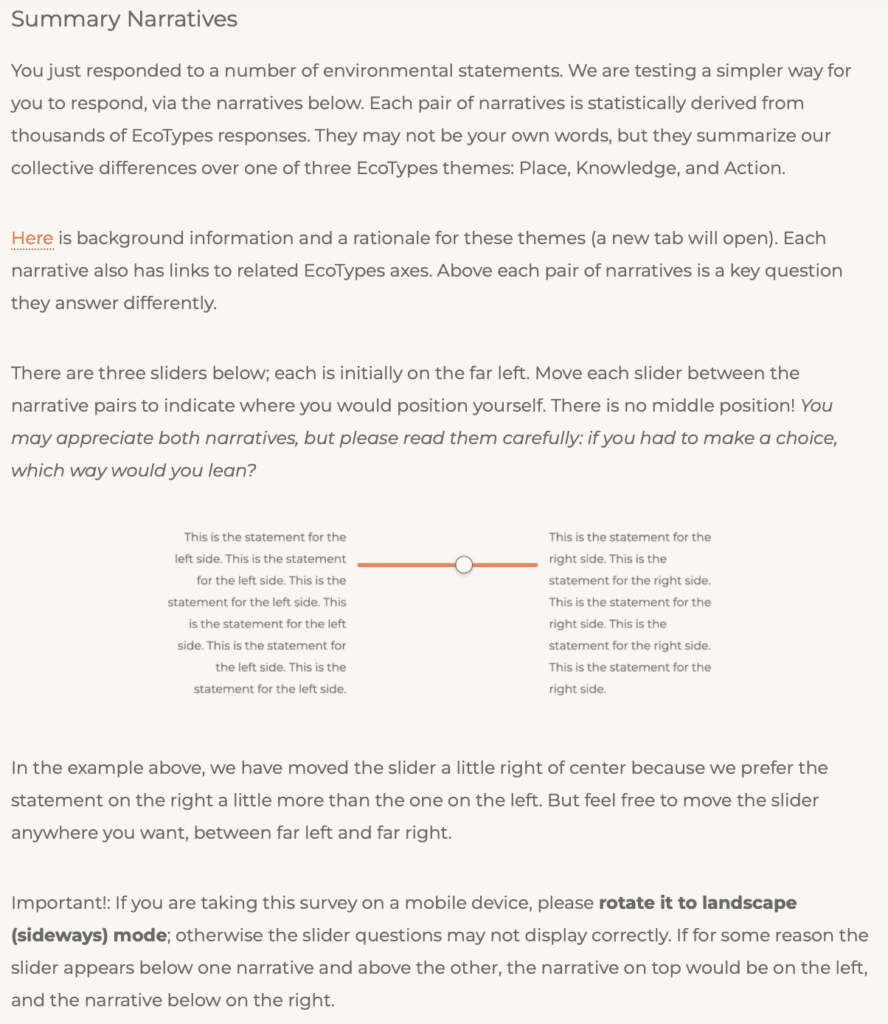
Screenshots of the components of this one-page theme survey are below.
Results
Overall, the theme survey performed relatively well, as determined by simple correlations between the theme score participants received via the full vs. theme survey. The Place theme correlation was, however, somewhat less strong. There were other surprising results too!
Let’s discuss these results, all based on over 700 completed surveys in early 2024. The below gets into some statistics, with links to terms when they first appear.
Overall results
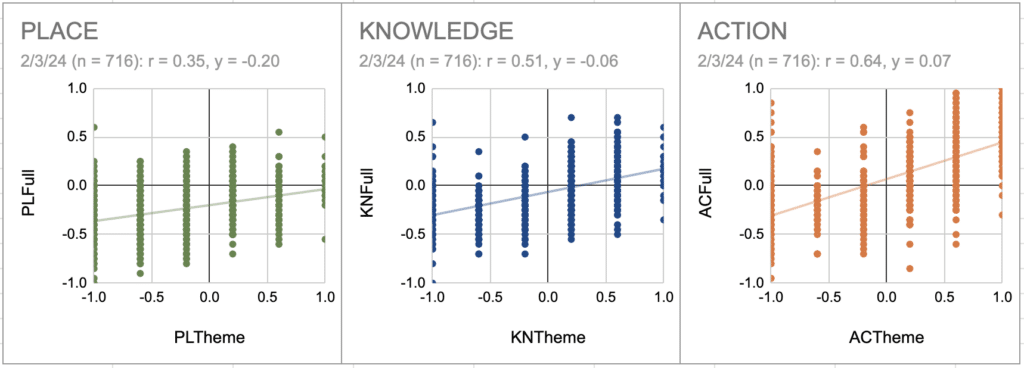
Three quick charts summarizing respondent scores for Place, Knowledge, and Action from the full survey (y axis), calculated as simple unweighted means of their four contributing axes, vs. their direct scores from the theme survey (x axis) are below. At top are the n (number of responses), r (correlation coefficient), and y-intercept. (The dots include many stacked on top of each other near the regression line, so the overall distribution is different from how they look in two dimensions.)
The correlations for Knowledge (0.51) and Action (0.64) are especially strong. Additionally, the y-intercept is near 0 for both: this result shows us that the overall results generally preserve respondent positions relative to old vs. new Knowledge, and small vs. big Action.
Place results: Correlation
But these results are a bit different for Place: the correlation was 0.35, still acceptable but not as strong. In part, this is because scores for the four Place axes—Aesthetics, Ecosystems, Ethics, and Nature—diverge more than for other themes. Respondents have reported that they struggled with where to position themselves relative to the two Place narratives, given that they agreed with certain parts of each narrative and disagreed with others. (This also reportedly happened with Knowledge and Action, but less so.)
Let’s think about how Place relates to its four axes. The Place narratives in the theme survey are a composite of statements representing all four Place axes, derived via factor analysis of all twelve axes. The difference between responses summarized as Place resonated in these four axes as well, thus factor analysis grouped them together.
If our intent in EcoTypes were to create multiple items that closely relate to Place, we could see how well they fit together via a statistical measure known as Cronbach’s alpha. This is not how EcoTypes evolved!: we started with many (up to 18) fundamental environmental considerations or axes, then inductively searched for patterns of difference via factor analysis. But, looking at Cronbach’s alpha for roughly 2750 responses in 2023-24, we can indeed see a lower alpha for Place (0.50) vs. Knowledge (0.56) and Action (0.75).
These correlation (and Cronbach’s alpha) results for Place require situating in the overall learning intent of EcoTypes. You’ve perhaps read on the survey FAQ that themes have attractors, not poles, due to their empirical, elusive nature, but also due to the role they may play in our lives: they attract (or repel) us. Though one might think that a more robust measure of Place would come from its eight related axis statements, directly confronting the nonhuman and human attractor narratives for Place puts one in a more direct opportunity to ponder their differences—which, as the underlying theory introduced on EcoTypes FAQ suggests, may lead to important learnings, via complementarity and “counting beneath two.”
Place results: Y-intercept
There is another important Place result to consider as well: its y-intercept in the chart above. In contrast to Knowledge and Action, the y-intercept for Place was far from 0 (-0.20 on a scale of -1 to +1, with averaged results tending to reduce variance). This means that, overall, a full survey Place score of -0.2—definitely leaning toward nonhuman Place—corresponded with a theme survey Place score of 0—right in the middle between nonhuman and human Place.
In other words, the theme survey scored more participants in human Place than the full survey; as such, more would receive human Place EcoTypes (Technoprogress and Traditional Ways) in the theme vs. full survey. The two surveys may thus result in differing patterns of EcoTypes, primarily along lines of Place!
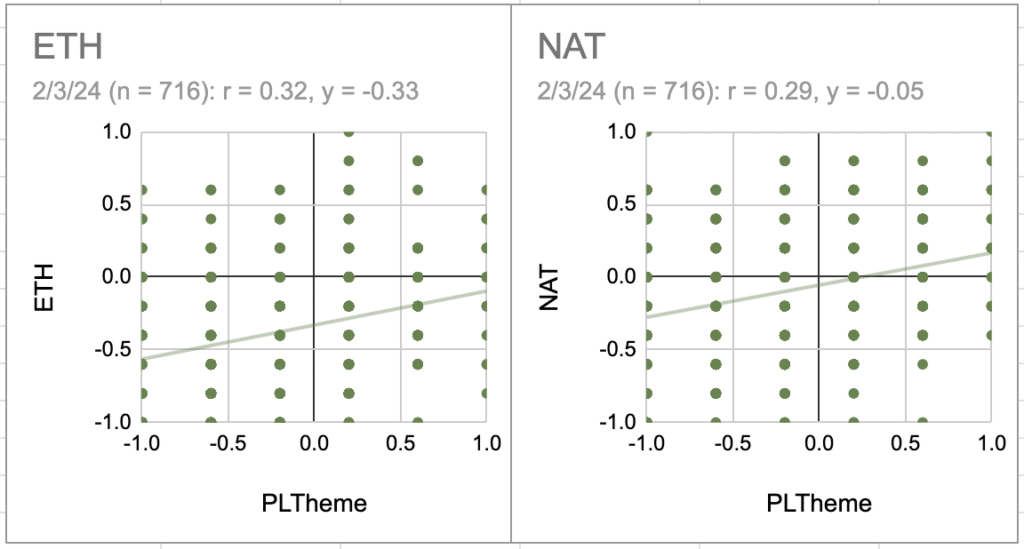
Let’s look at two Place axes in addition to these overall results. Two axes that correlated fairly well with the theme survey Place score are Ethics and Nature; below is a chart similar to the above correlating these axis scores to the theme survey Place score. (Remember that dots are stacked on top of each other near the regression line.)
Given what you learned about the all-important y-intercept result above, you might have immediately noticed a similar, indeed stronger, result with Ethics, where a score of -0.33 corresponded with a theme survey Place score of 0! With Nature, in contrast, the y-intercept was much closer to 0. What does this mean? Interestingly, Ethics is one of the most understandable Places to most participants, with biocentric vs. anthropocentric poles. Overall, those who leaned strongly in the biocentric (left or negative axis) direction scored much closer to 0 when positioning themselves relative to the contrasting Place narratives. The difference between pure vs. hybrid Nature, in contrast, seems to have been a more accurate predictor of where respondents would score relative to nonhuman vs. human Place.
These y-intercept results suggest that the theme narrative survey tends to move responses toward human Place. Given that many surveys are completed by undergraduate environmental students, the overall full survey results are skewed toward nonhuman Place. The theme survey may thus result in a greater diversity of results along nonhuman to human Place—possibly a good thing, if discovering difference (say within a classroom) is the desired objective.
Next steps
What do we make of these results? Remember that EcoTypes is not a pure research initiative: it’s also designed for learning. As noted via methodological notes in EcoTypes FAQ, other important statistical decisions have been made with educational outcomes in mind, and this shapes our thoughts moving forward with the theme survey. Here are two possible advantages (or disadvantages) to consider.
- The theme survey is quicker to complete. This may be especially important if we wish to engage with diverse communities around our differences, as in this example, as many people are understandably reluctant to complete a long survey—in fact, the theme survey is so brief it can be administered directly and dialogically. One related disadvantage, however, is that the theme survey does not produce axis scores, which themselves are of educational value.
- The theme survey directly measures themes. In the full survey, themes are calculated from axis scores; the theme survey has actual narratives respondents consider as they position themselves. Though these are statistically derived narratives, narratives—stories—are arguably how people make sense of things. The above results suggest, however, that theme survey EcoTypes may not be the same as full survey EcoTypes; this may be an advantage or a disadvantage depending on your intent.
We will thus continue with the theme survey, possibly in these forms:
- The EcoTypes survey currently includes both the full and theme version (along with SDG priorities and demographics). We may add an option at the first of the survey to see which version (or both) respondents prefer; they would complete only those portions.
- We are creating a pilot version of hardcopy survey cards, consisting of (a) an introduction for respondents to indicate their willingness to participate, (b) three cards, one for each set of contrasting theme narratives, with a scale of six possible positions as in the digital survey, and (c) one final card of SDG priorities. (There would not be a demographics card, to ensure privacy.) We plan to test these cards in student projects this spring, in the U.S. and Europe, and will report results in time.
EcoTypes has gone through continuous development since its inception in 2017; we hope that the new, brief themes survey may be a helpful addition. Feel free to get hold of us if interested or you have thoughts on the above.
