Here are some answers, with accompanying images, to questions you may have about your survey report. Most questions are arranged in the order they appear on your report.
What is my entry key and why should I remember it?

Your four- or five-digit entry key is an automatically generated random code you can use to retrieve your report at any time. Since your submitted data are fully anonymous, we cannot help you find your report if you lose this entry key!…write it down somewhere so you can remember it.
What does my polarity score mean?
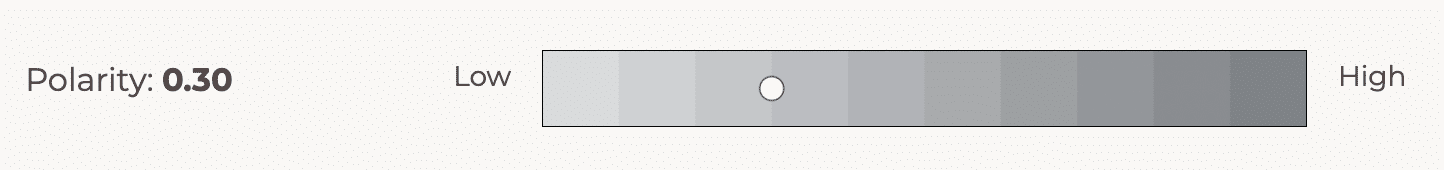
Your polarity score is the average (expressed from 0 to 1) of all your environmental statement scores. When you responded to each statement, “strongly” disagree or agree were scored as +/- 1.0; disagree or agree were scored as +/- 0.6; and “slightly” disagree or agree were scored as +/- 0.2. Your polarity score is the average of the absolute value of all 24 axis statement scores. Below is a summary distribution of recent polarity scores you might use to compare yours to others.
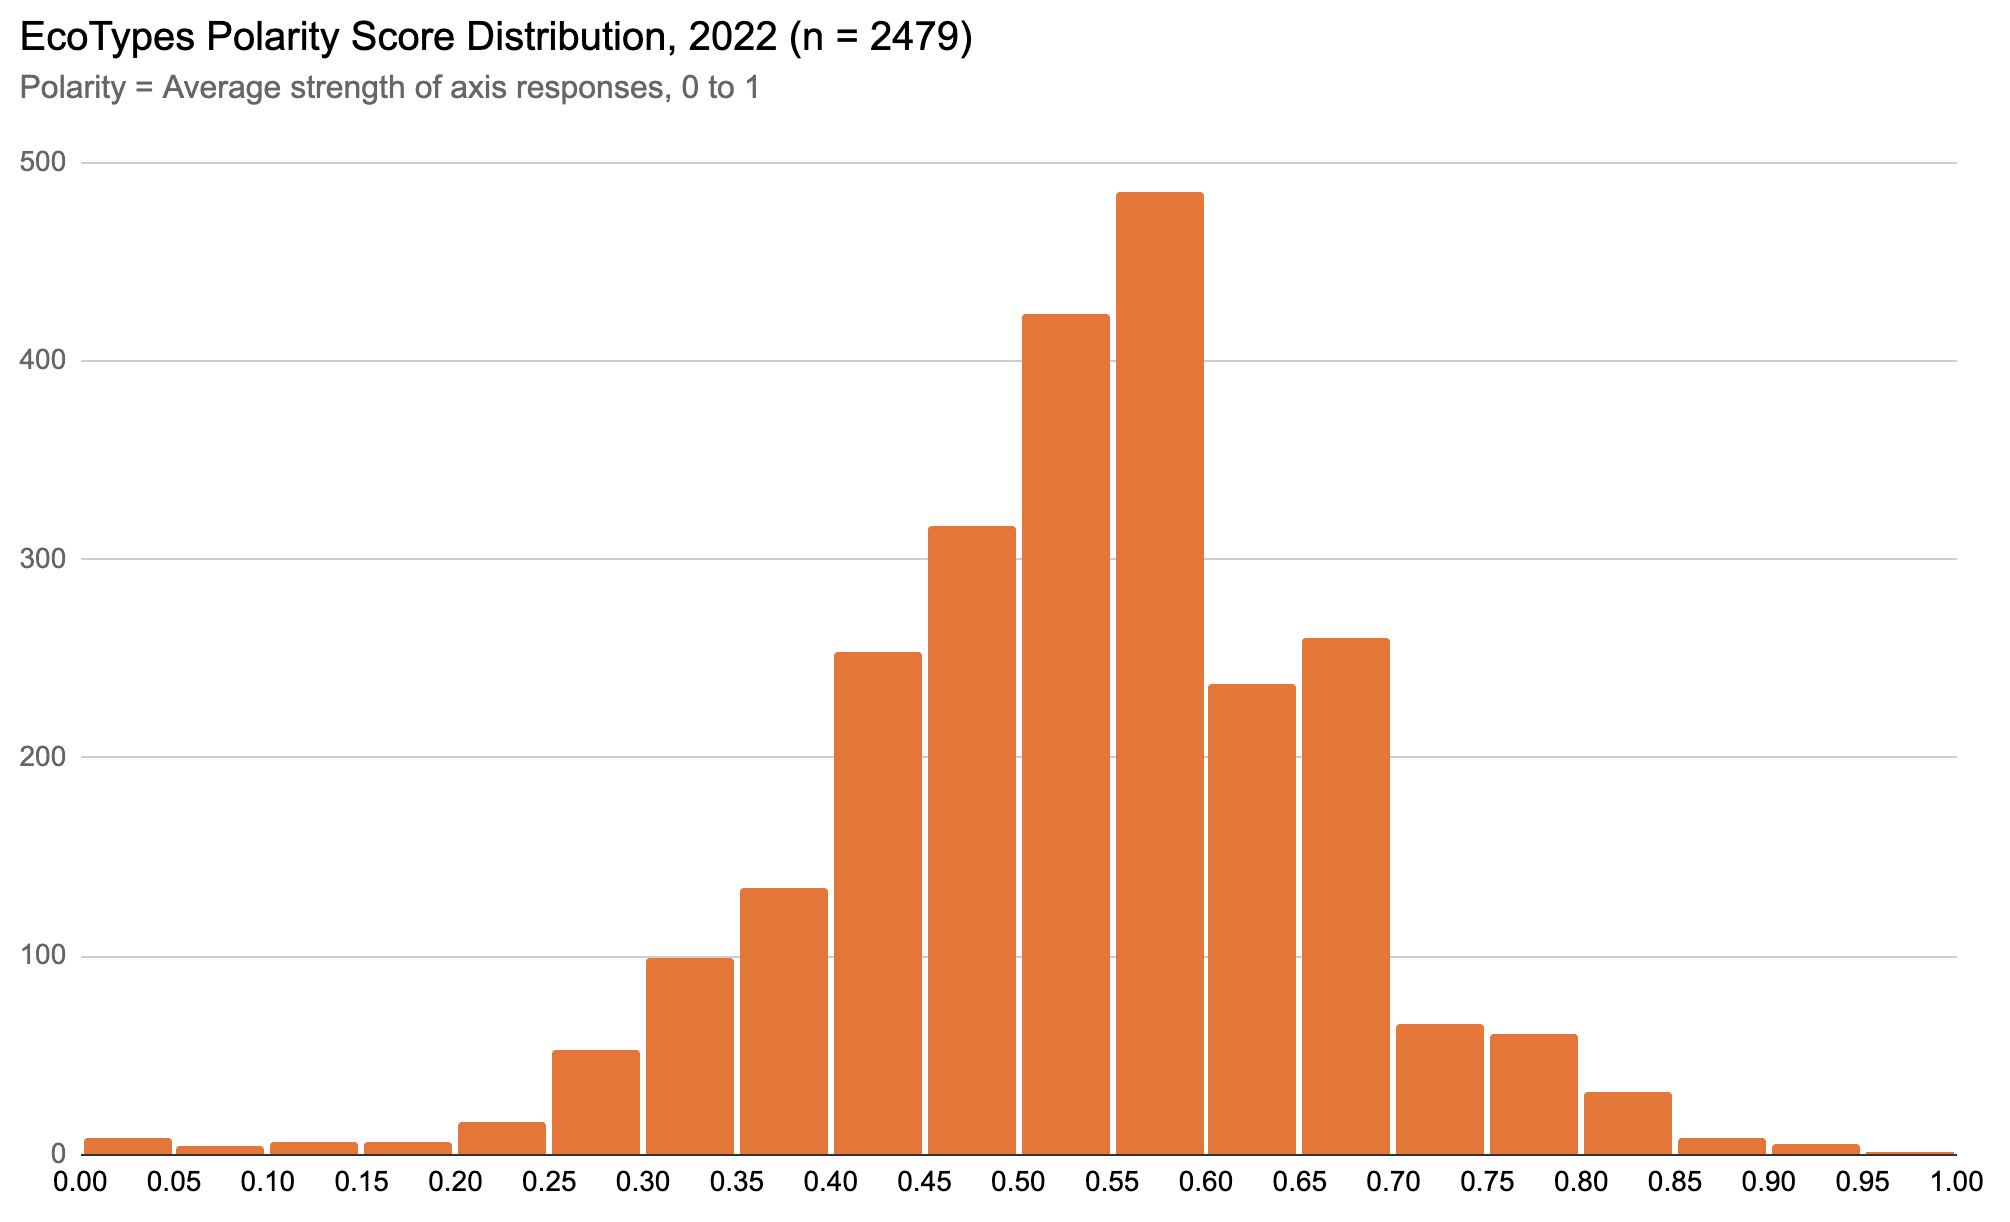
High (or low) polarity scores are not necessarily a good or bad thing! There may be all sorts of reasons why you might display high or low polarity relative to someone else, or yourself over time. You may find, for instance, that your polarity score increases over time as your environmental opinions settle; you may, conversely, find that your polarity score decreases over time as you appreciate the full range of opinion.
Do engage with someone whose polarity score is quite different from yours. What do you discover as to possible reasons?
Why do axes have poles, and themes have attractors?
An important but sometimes confusing feature of EcoTypes is that axes have opposing poles, and themes have opposing attractors. This may sound like a bad binary way of approaching axes and themes! In fact, our intent is quite different: read the EcoTypes FAQ (“What is the theory underlying EcoTypes?”) or the FAQ below on complementarity to appreciate how binaries might lead to something far deeper.
Axis poles derive primarily from difference. Each axis represents a fundamental consideration in how we approach environmental issues, for which there are genuine differences of opinion; the poles quickly summarize these differences, and operationalize them for the survey.
Some people may support one or the other pole; others may position themselves somewhere in between. There is no right or wrong position relative to these axis poles, but they do encourage you to think hard about your own opinions (this is also why there is no middle position on each environmental statement). There can be other opinions related to EcoTypes axes that don’t necessarily involve their poles, but axis poles offer us a common basis for discussion, and a way to score our positions in the EcoTypes survey.
Yet the twelve EcoTypes axes do not necessarily represent twelve separate differences in how we approach environmental issues. This is where the three EcoTypes themes, and their respective attractors, come in. These themes, Place, Knowledge, and Action, are statistically derived from axes using a technique called factor analysis. Factor analysis results in factors (themes) that group variables (axes) based on their greatest common differences, statistically known as variance.
Theme attractors are derived from their contributing axis poles; attractors thus represent our most fundamental differences. As with axes, some people may score near one or the other theme attractor, or somewhere in between. These theme poles are called attractors for theoretical reasons, more fully developed in the EcoTypes book: think of each as an attractive, common, yet only partial solution to the complex question posed by each theme.
How did you come up with twelve axes and three themes?
There can be many potential EcoTypes axes; in past there have been as many as eighteen. The current twelve axes represent the top four related to each statistical theme, and offer a more manageable number of fundamental considerations, for instance in educational settings, while preserving the EcoTypes intent of broadening our scope of consideration. See the EcoTypes FAQ (“How does the EcoTypes approach compare with others?”) for further explanation.
As explained above, the three themes were derived statistically from factor analysis. There are several measures one may use in factor analysis to decide on the optimal number of underlying factors (themes); EcoTypes survey data have long suggested three themes, even when more than twelve axes were included.
What do my axis and theme scores mean?

The EcoTypes survey includes two contrasting statements for each axis, to allow for responses across the full range of potential difference—the two axis poles. Your axis scores, the average of the two statements, range from -1 to +1, representing the left and right poles. These scores are only for two statements, so they are just an approximation of how you may feel about each axis.
Your theme scores are the average for all contributing axis scores, and thus also range from -1 to +1—the left to the right attractor. Since each theme represents four axes, your theme scores are for eight statements each, thus may be more robust than your axis scores.
See the question below to assess how well your theme scores may fit you. See also the manual scoring question at bottom for a summary of why theme scores are calculated as unweighted means of axis scores.
How do I know if my theme scores are a good fit for me?
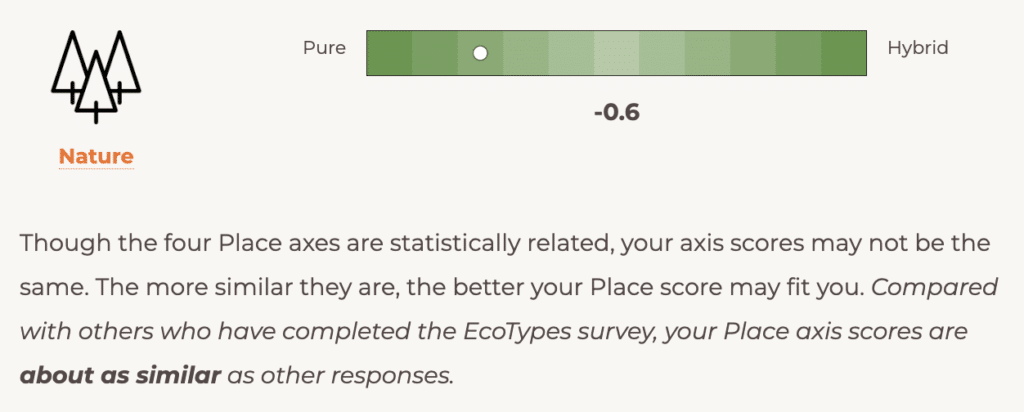
Though the four axes contributing to each theme are statistically related (i.e., considering all responses), they may or may not be strongly related in your case. So, below the axis scores for each theme, you’ll see an estimate of how well your theme score may fit you, based on the spread of your axis scores. If your four axis scores are relatively similar, this may indicate that your theme score is a good fit.
The fit you are presented on the report derives from analysis of several thousand recent responses, where the average difference between the highest and lowest contributing axis scores is approximately 0.7. Based on this analysis, you’ll see your fit as “more similar,” “about as similar,” or “less similar” than other responses.
Of course, it is up to you ultimately to decide if your theme scores are a good fit!
How do I know if my EcoType is a good fit for me?
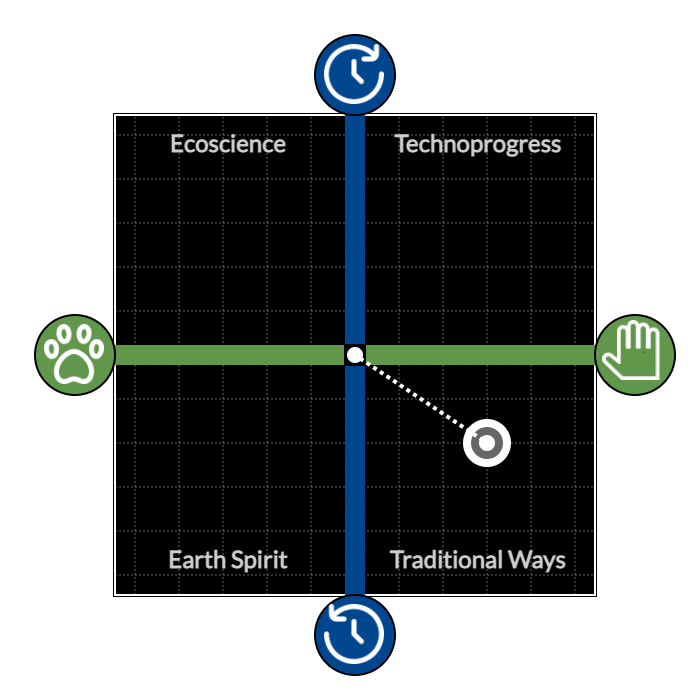
Your EcoType consists of a phrase summarizing your Place and Knowledge scores, and a suffix summarizing your Action score. Your Place and Knowledge scores result in the dot you’ll see on your EcoTypes chart. The placement of this dot may indicate how well the EcoTypes phrase fits you: stronger Place and Knowledge scores (i.e., those farther from 0, the chart origin) may indicate a better fit.
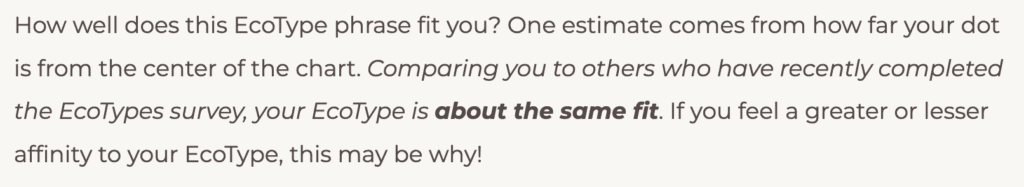
Similar to how we estimate your theme score fit summarized above, we compare the distance of your chart dot from the origin with distances of several thousand recent responses. Distances between the 40th and 60th percentile of this overall distribution are “about the same fit”; those farther from the median range from “a much less strong fit” to “a much stronger fit.” As with your theme score fit, it’s ultimately up to you to decide whether your EcoTypes phrase is a good fit! This is especially true if your chart dot is near the horizontal or vertical axis, i.e., close to another EcoType.
The fit of your Action suffix is simply your Action score: those scores farther from 0 are more clearly small or big Action. Here, too, the ultimate choice of whether your Action suffix is a good fit is up to you.
As you consider the overall fit of your EcoType, bear in mind that EcoTypes represent broad frameworks, based on the most common differences among ourselves in patterns of Place, Knowledge, and Action. It is possible that, at this general scale, your EcoType may indeed be a good fit, even if it neglects important details about you as an individual, and how you personally approach environmental issues.
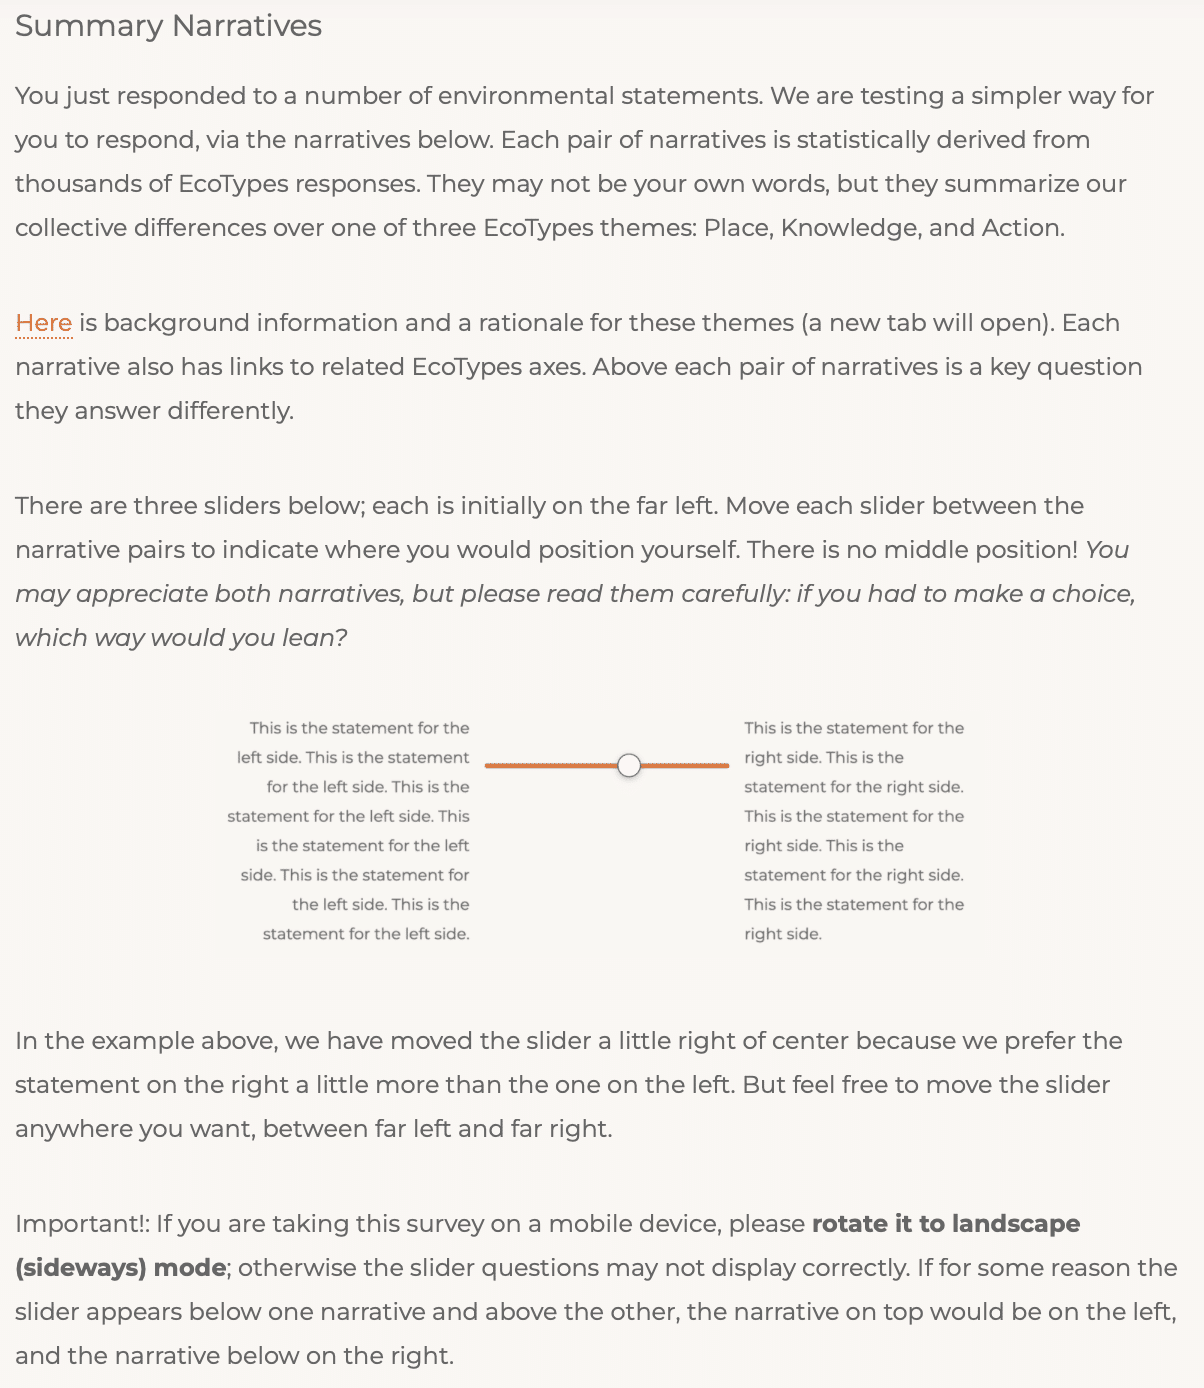
What is my “summary narrative” EcoType, and how does it differ from the above?
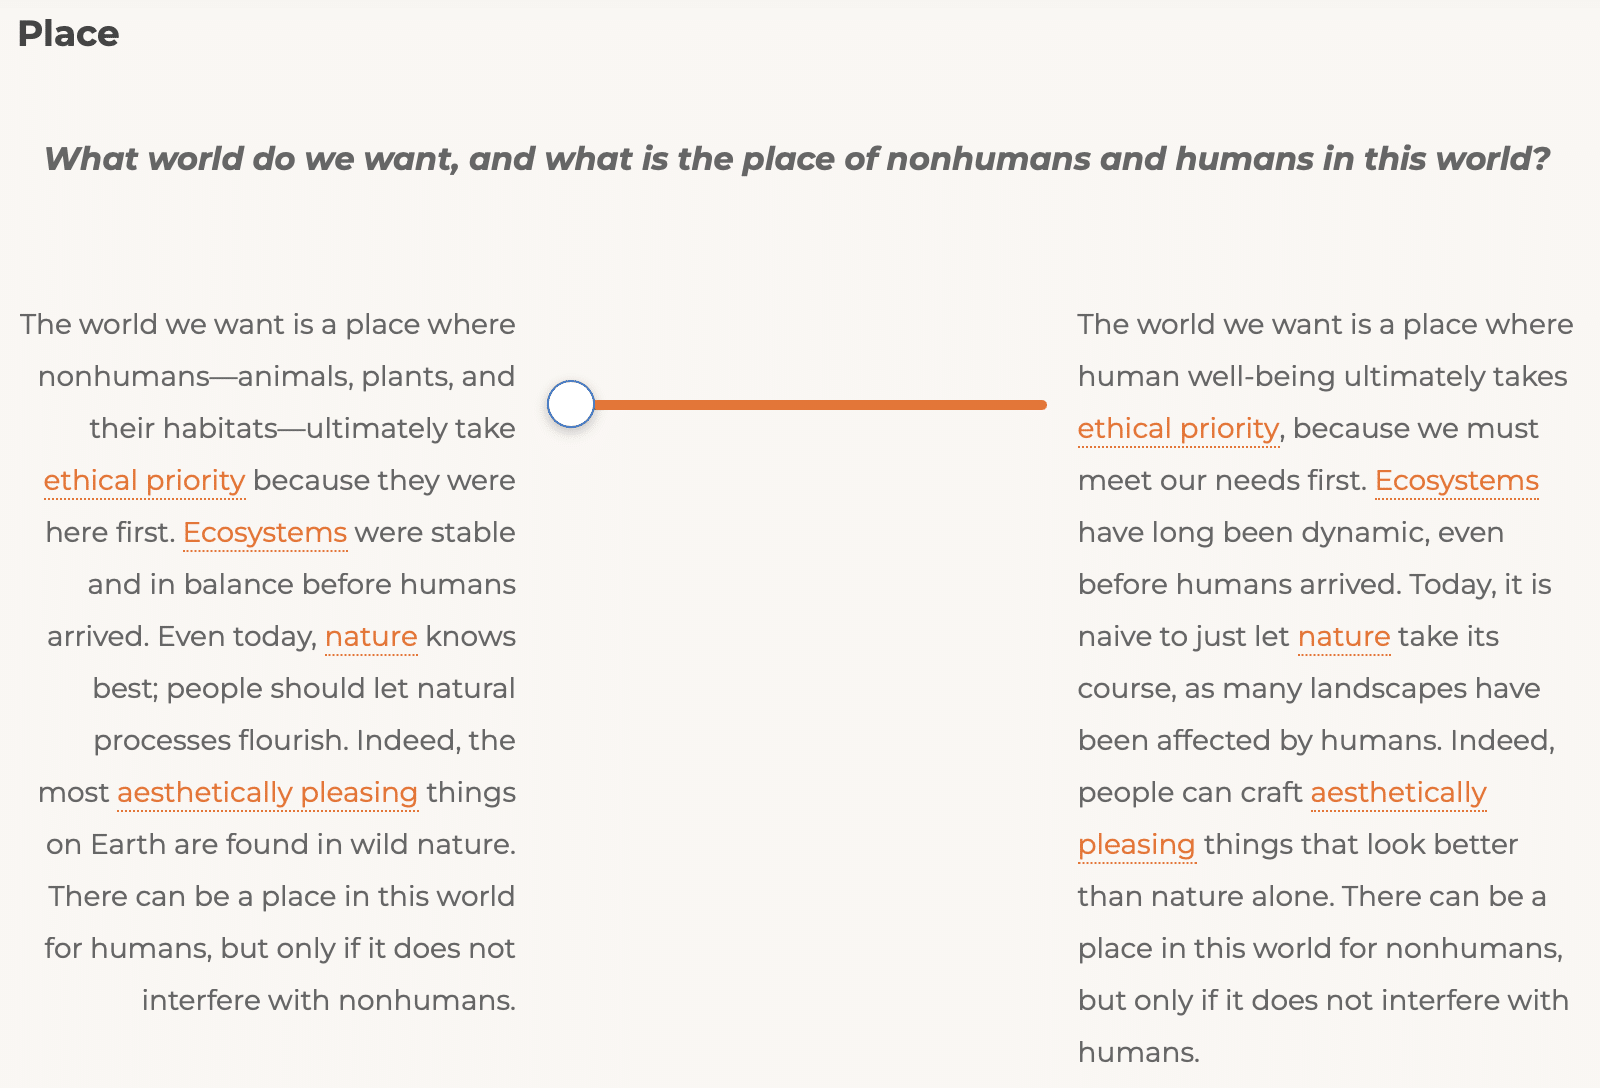
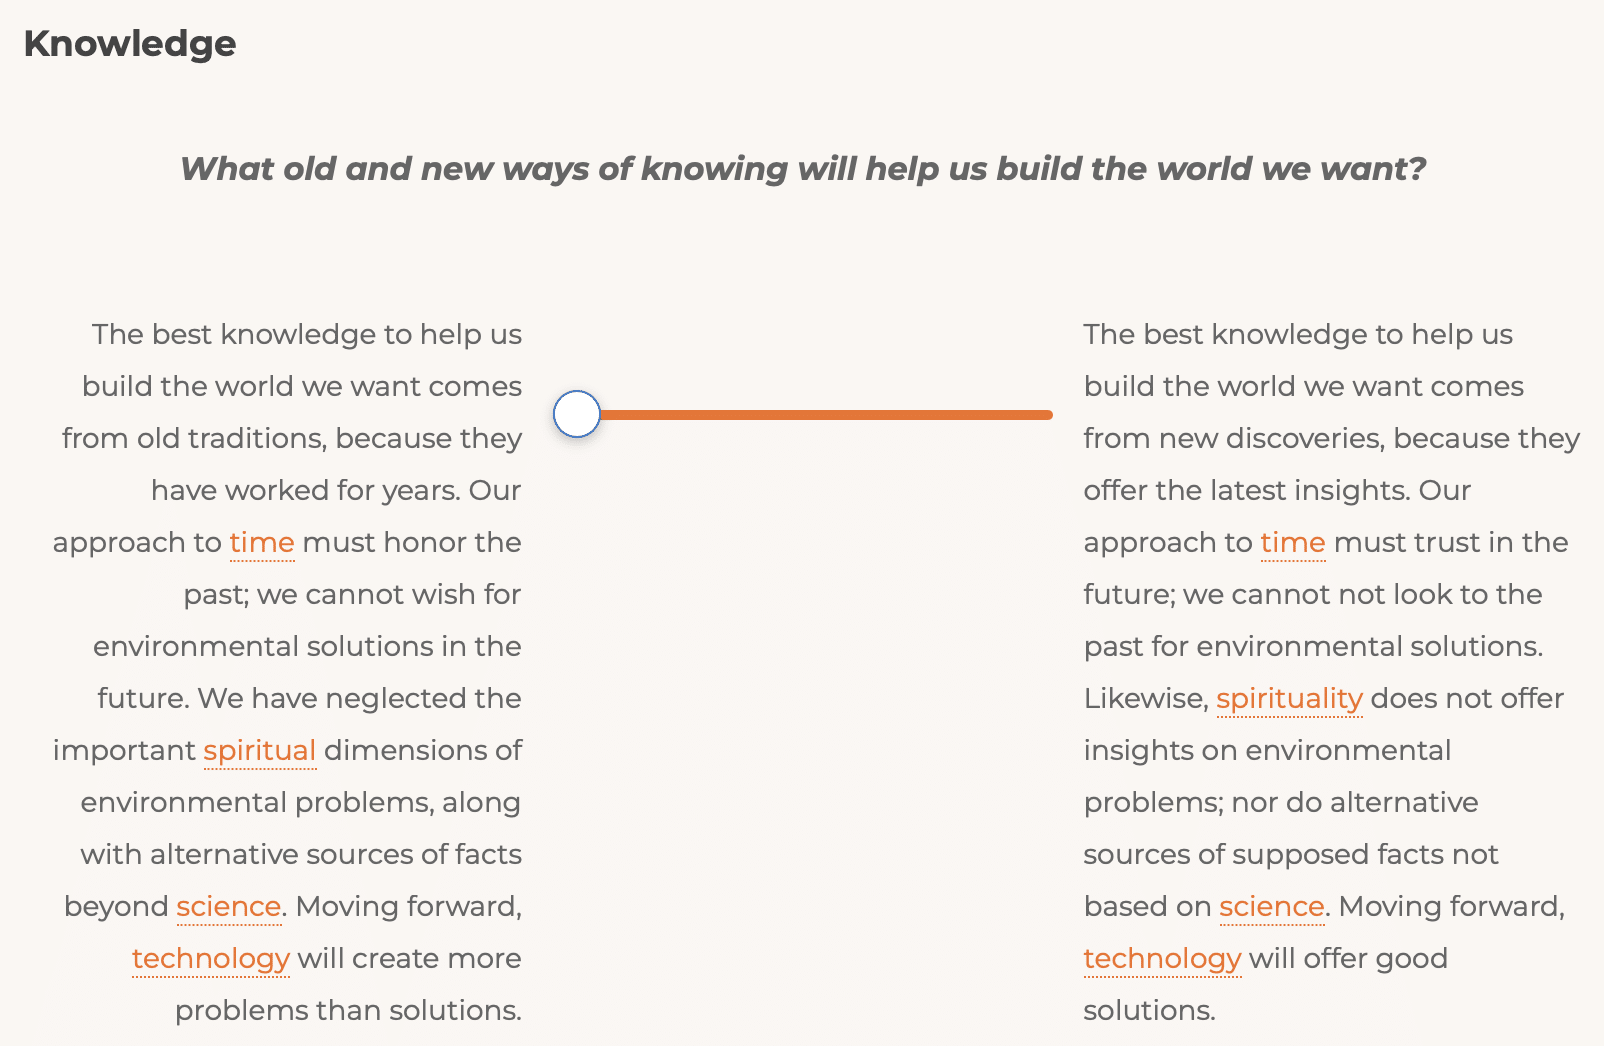
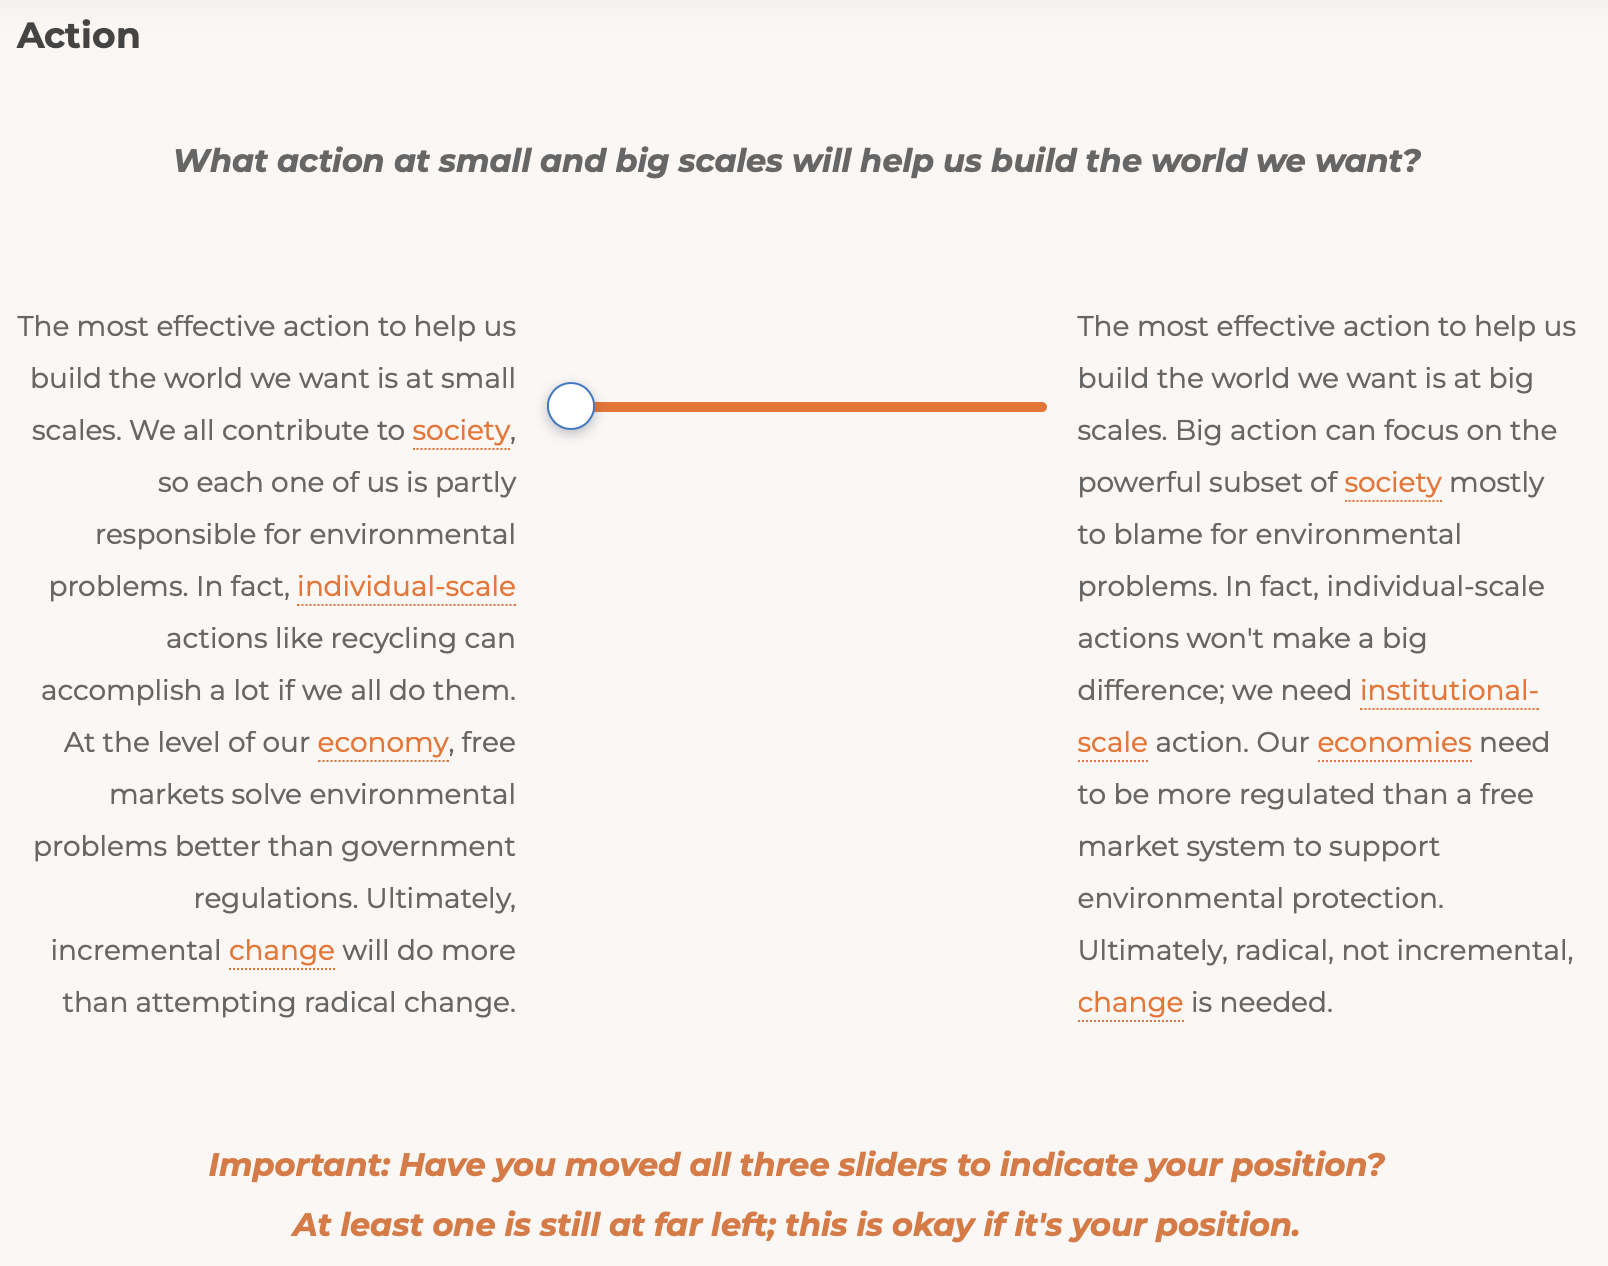
As of 2024, we are testing a simpler way to determine your EcoType, via three pairs of summary narratives representing all four axes related to each of the three EcoTypes themes of Place, Knowledge, and Action. In the survey, you moved three sliders to indicate your position between two contrasting narratives for each theme; your summary narrative EcoType derives directly from these three scores.
You may find that your summary narrative EcoType is exactly the same as the one above; or, you may find it to be different. [If your EcoType above was on a boundary, this one will definitely be different—there are no boundary EcoTypes here.] What may be some reasons your two EcoTypes night be different?: remember that they derive from different portions of the survey.
It’s possible that you struggled with positioning yourself anywhere other than the middle on one or more of the three themes! Make sure to read the EcoTypes FAQ (“What is the theory underlying EcoTypes?”) for a justification.
If you’d like to think more about, or discuss with others, your summary EcoType, the gallery below has screenshots of the summary narrative instructions and three contrasting narrative pairs (all initially set to the far left, thus the notification under Action). Or, you can head on over to the Themes page, with greater information on each theme, and links to related axes.
Am I supposed to be just like my EcoTypes persona?
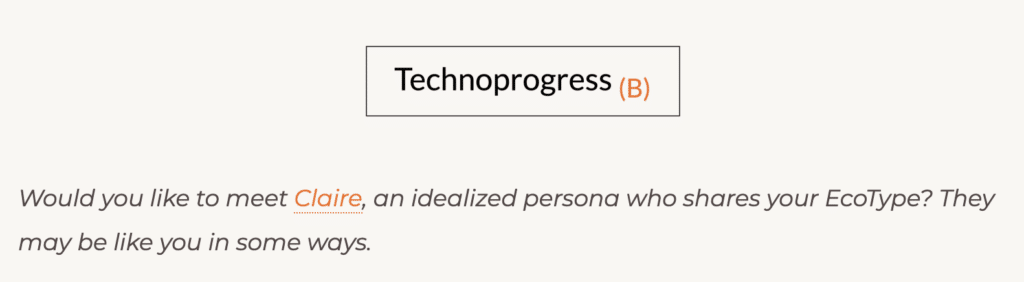
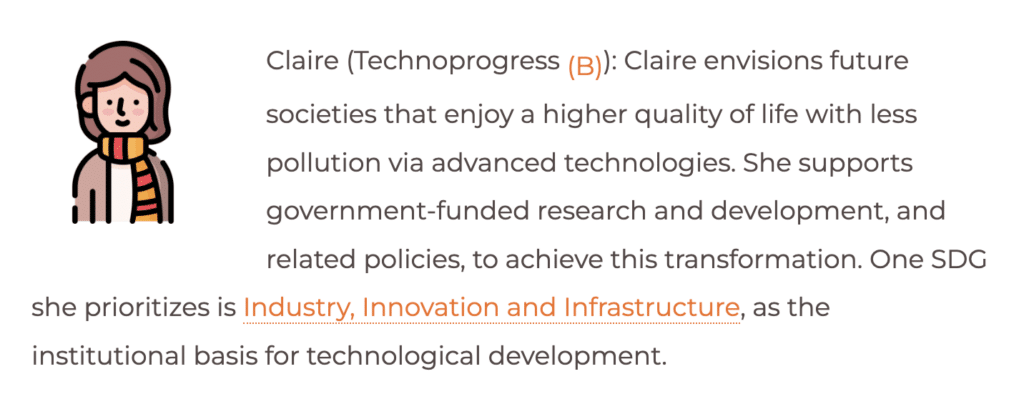
No, you are likely not the persona linked with your EcoType! Many different people might share the same EcoType. The eight personae were created to illustrate each EcoType and how they differ, thus to illustrate the EcoTypes possibility that many care, just differently. Yet you may indeed find something in your EcoTypes persona that resonates with you more than the other personae, as your persona shares with you their broad approach to Place, Knowledge, and Action.
As you explore all EcoTypes personae, you may find interesting similarities and differences: for instance, Earth Spirit and EcoScience personae are similarly motivated by nonhuman Place, whereas Traditional Ways (S) and Traditional Ways (B) personae seem quite different, given their differing approaches to Action. If your EcoType is not a strong fit (see above), it’s possible that another EcoTypes persona may resonate more with you, or that one quite close to you may feel different.
What is my complementary EcoType?
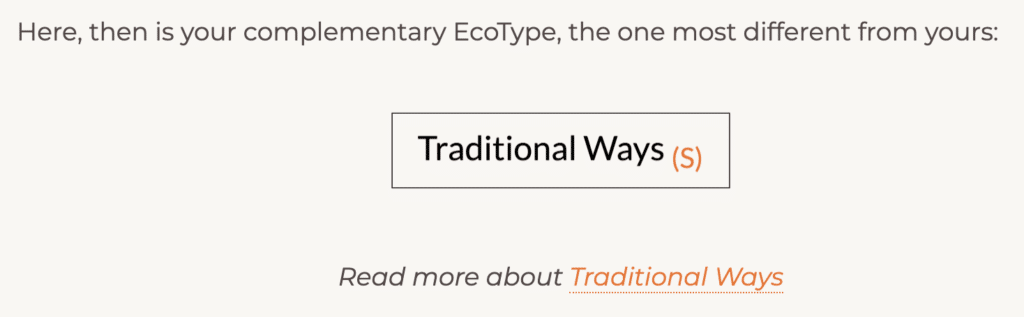
Your complementary EcoType is the environmental framework that differs from yours the most. It’s easy to identify your complementary EcoType: just go to your EcoTypes chart and look for the sector opposite your dot. Then switch your Action initial as well.
Complementarity is a principle derived from physics, in which two opposing descriptions of reality are each true, yet a fuller truth arises from considering them both. The differences embedded in EcoTypes arise from our differing interactions with reality and can be a strength, if we are willing to engage with people whose EcoTypes differ from—indeed, may be the opposite of—ours.
You may want to explore your complementary EcoType by engaging with someone who has been assigned it, or by reflecting on the related EcoTypes persona. Complementarity isn’t about agreement!…but it’s not about simple disagreement either. Exploring your complementary EcoType is more like creative tension, whereby your EcoType is true to your experience of reality, the complementary EcoType is true to a differing experience of reality, and the both offer a fuller truth—even though they may contradict each other. This may sound impossible…but try it!
Why didn’t I receive an EcoType or complementary EcoType?
You may have received this notice on your report: “We are sorry, but we cannot assign you an EcoType.” This is because your Place, Knowledge, and/or Action scores were right on the border, i.e., 0. This is not necessarily a bad (or a good) thing! But what you can do is take the EcoTypes survey again: maybe next time your scores will place you into an EcoType.
How do our EcoTypes relate to our global priorities?

Most of us think a lot about the things immediately around us, but we also share this larger world, so EcoTypes is designed to prompt discussions around our respective global priorities.
And the possibility we consider in EcoTypes—many care, just differently—almost certainly applies to our global priorities. These differences may arise in part from our differing environmental frameworks—our EcoTypes.
The EcoTypes survey includes a section on your global priorities, based on the United Nations Sustainable Development Goals (SDGs). In the same way that your EcoType—your environmental framework—is related to a wide range of considerations (EcoTypes axes) including but not limited to what we think of as “environmental” ones, the SDGs include a wide range of global priorities, including but not limited to “environmental” ones. So, for instance, Climate Action is an SDG, but so are No Poverty, Gender Equality, and others.
Each EcoTypes persona is tied to a possible SDG priority to exemplify the differing ways they might care. And, as your report suggests, studies of popular and expert SDG priorities also suggest important differences among people.
Compare your EcoTypes report to that of a friend or classmate. Share the top four global priorities you selected, as well as your respective EcoTypes. Can you see any possible connections?
The Going Deeper page offers some practical next steps on how you might use these global priorities as a way to go deeper with EcoTypes, via engagement across difference.
Can I manually calculate my theme scores and EcoType myself?
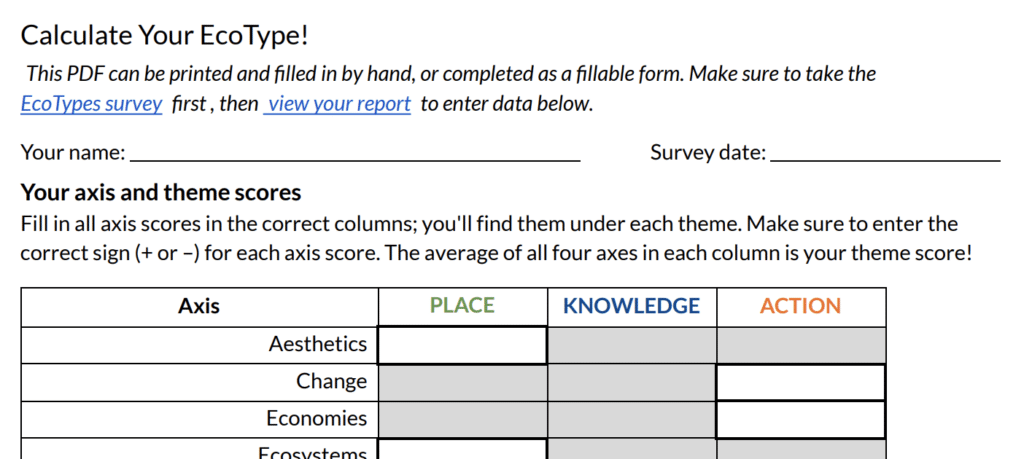
Yes! Just download this fillable PDF form, and digitally complete it or print and fill in the blanks.
There is no big mystery to EcoTypes: in fact, EcoTypes has been simplified in recent years so that you can calculate your theme scores and EcoType (and complementary EcoType) yourself—without a statistically significant loss in precision. (Correlations in EcoTypes between the current, simplified method and the earlier method using factor weights, K-means cluster analysis, etc. are around 0.95…extremely strong.)